PV MONITORING PLATFORM
SolarPortal
Real-time monitoring, curtailment analysis, and EEG financial settlement for your entire PV fleet — from edge device to dashboard.
THE PLATFORM
Monitor. Analyze. Comply.
gTNT SolarPortal gives installers, energy companies, and plant operators a single pane of glass over their entire PV fleet — from real-time power output and device health to historical performance analytics, regulatory compliance, and automated EEG financial settlement.
CAPABILITIES
Everything You Need to Manage PV Plants
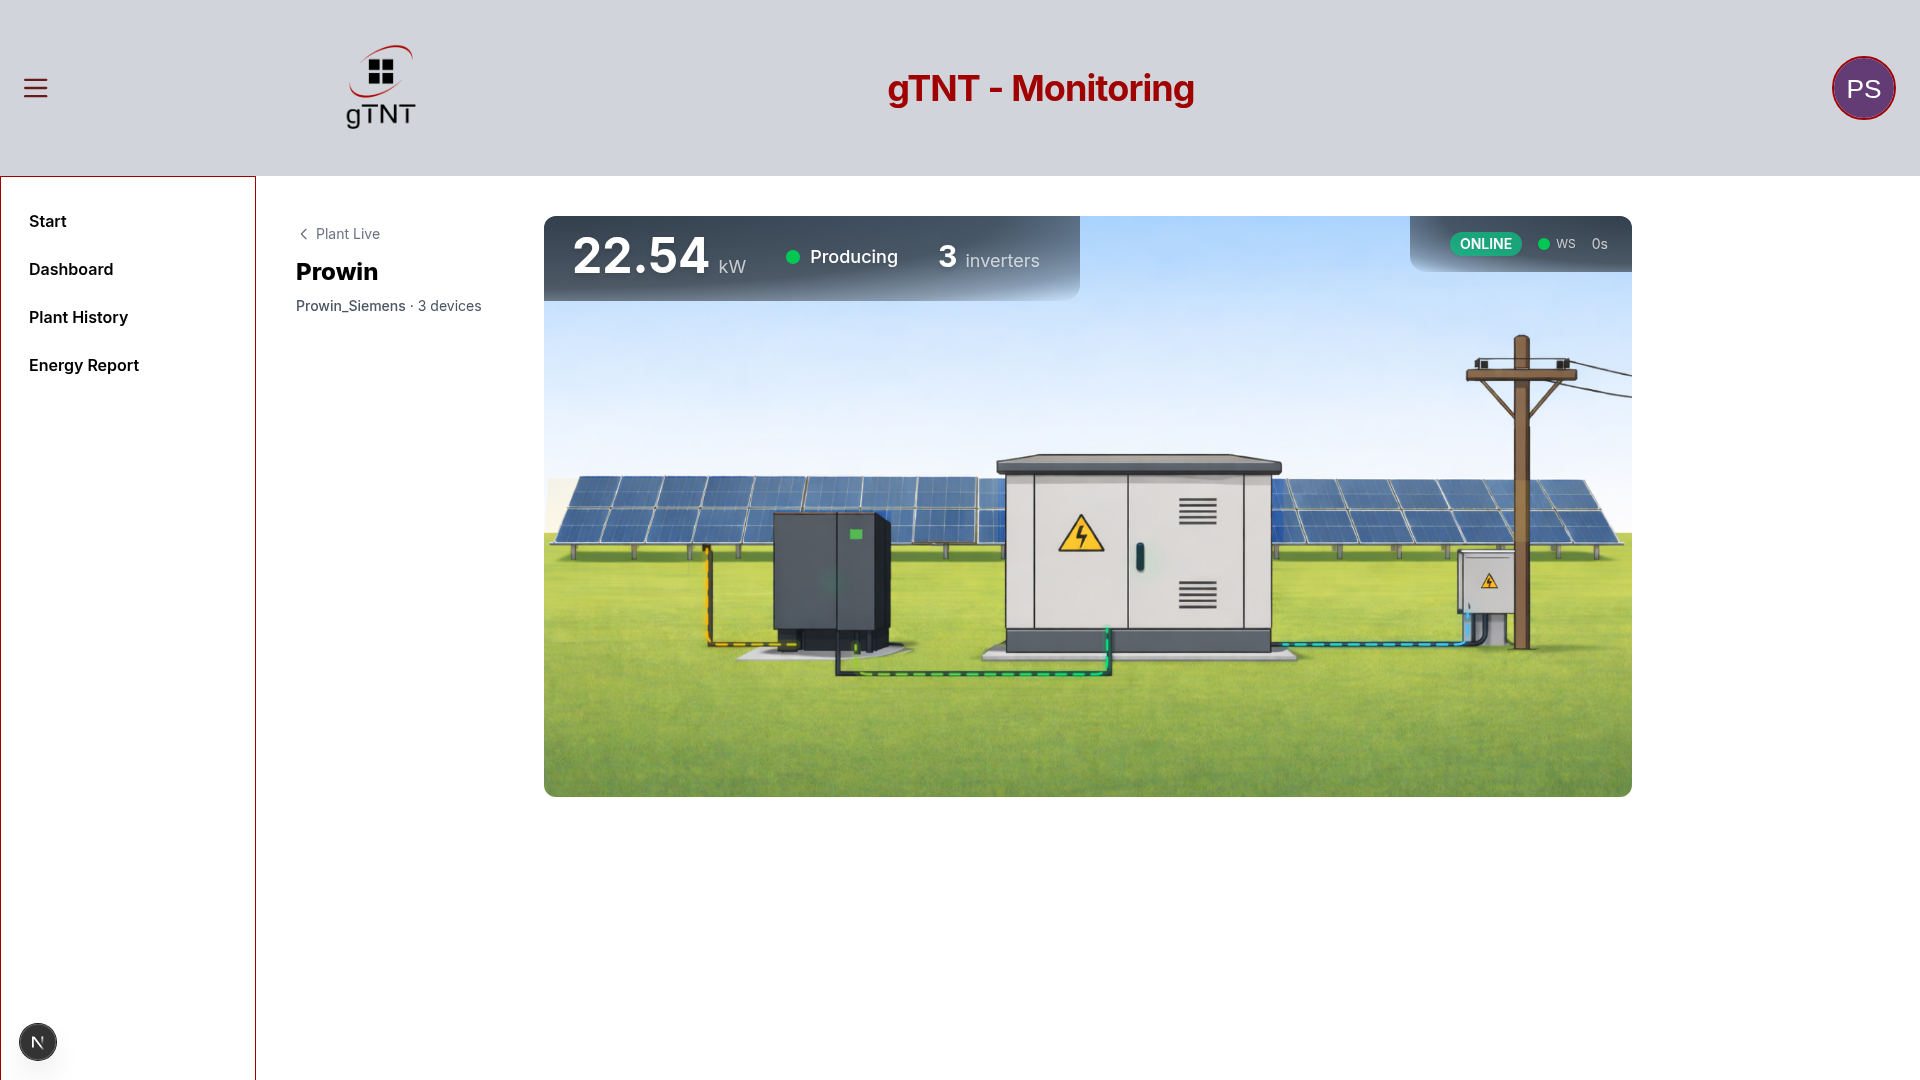
Real-Time Monitoring
Live WebSocket dashboards with animated energy flow. See power, voltage, frequency, temperature, and yield per device in real time.
Historical Analytics
Dedicated InfluxDB per datalogger with auto-provisioned Grafana dashboards. Smart resolution from raw data to hourly rollups.
Redispatch 2.0
Automated curtailment event ingestion from grid operator APIs. Cross-referenced against local measurements for auditable compensation claims.
EEG Settlement
Feed-in tariff, direct marketing, spot pricing, and self-consumption. Monthly revenue breakdown calculated from your actual production data.
Edge Integration
Raspberry Pi dataloggers with RS485, Ethernet, and proprietary protocol support. Self-registering with PKI certificates for mTLS.
Mobile Apps
Native Android and iOS with real-time WebSocket, plant overview, Grafana history, and branded PDF report generation.
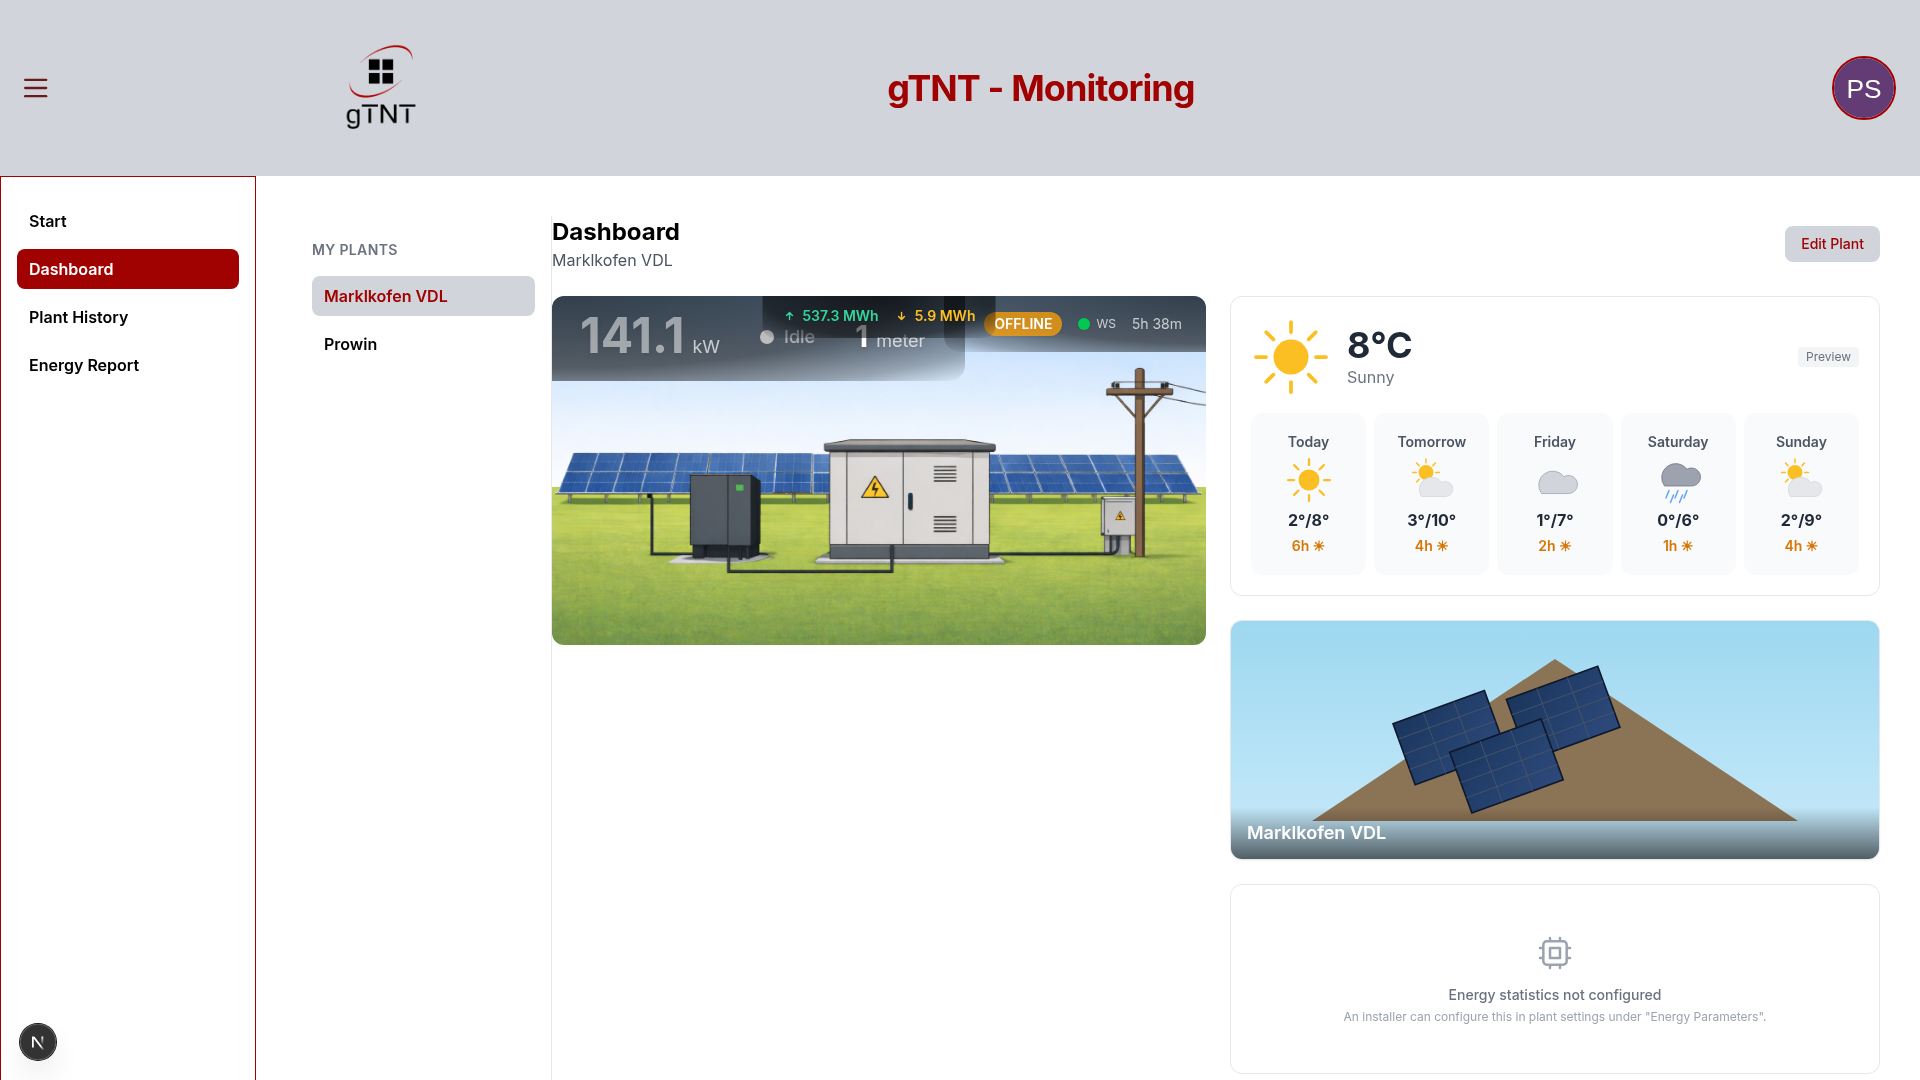
FLEET MANAGEMENT
Your Entire Portfolio at a Glance
Whether you operate five rooftop systems or five hundred open-field plants, SolarPortal scales with your portfolio. Multi-tenant by design.
- Per-plant online/offline status with live power
- Role-based access: Installer, Owner, Viewer
- Remote datalogger access — no VPN needed
- Custom branding per customer
HOW IT WORKS
From Edge Device to Dashboard in Four Steps
01
Connect
Install a Raspberry Pi datalogger, connect to inverters via RS485 or Ethernet. It self-registers with the cloud on first boot.
02
Stream
Measurements published every few seconds over MQTT with mutual TLS encryption. Heartbeat monitors device health.
03
Monitor
Live energy flow, device status, and metrics in the web or mobile app. Grafana dashboards auto-provision per datalogger.
04
Report
Curtailment analysis matches grid operator records. EEG settlement calculated automatically. Branded PDF reports on demand.
TECHNOLOGY
Built for Reliability
Container-based architecture with Django + ASGI backend, Next.js frontend, InfluxDB time-series storage, and Authentik identity management. Multi-tenant with isolated data stores per customer. Everything behind Traefik for automatic TLS.

COMPATIBILITY
Supported Protocols & Hardware
| Inverter Protocols | Modbus RTU, Modbus TCP, SunSpec, SMA, Siemens |
| Physical Interfaces | RS485, Ethernet, WiFi |
| Security | TLS 1.3, mTLS, PKI (EJBCA), Noise Protocol |
| Edge Hardware | Raspberry Pi (ARM64), custom Linux |
| Data Storage | InfluxDB (per-device), PostgreSQL |
| Identity | OIDC/OAuth 2.0, Authentik, PKCE |
Ready to see your PV fleet in real time?
Get in touch for a live demo — we’ll connect your first plant and show you what modern monitoring looks like.